
Occasionally, you might be asked to assist with identifying and fixing problems related to how a website or admin panel behaves. These problems might not immediately display errors, but they could be lurking in the background, causing the plugin to not work as expected. One useful tool that can help us both understand what’s happening is your browser’s developer or JavaScript console.
Let’s explore how to access it on most modern web browsers.
Google Chrome
- Open Chrome.
- Click the three vertical dots in the upper right corner (menu icon).
- Go to “More tools” and select “Developer tools.” You can also use the keyboard shortcut
Ctrl + Shift + IorCmd + Option + I(on Mac).
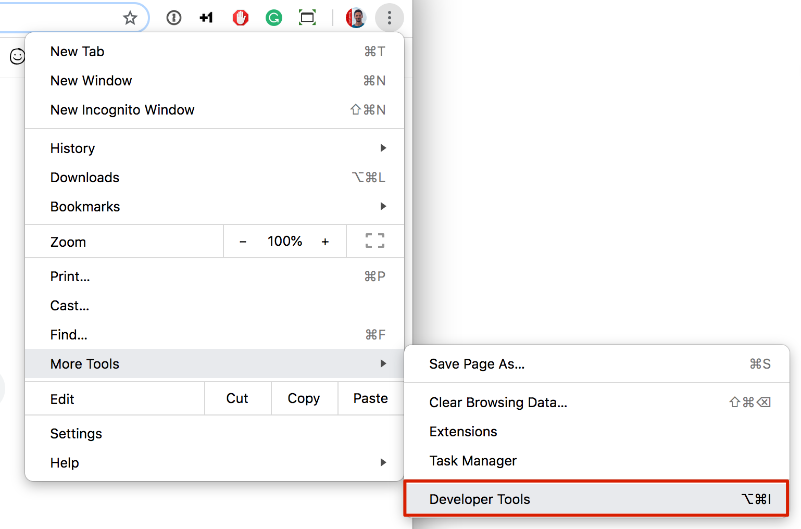
- The console will either open up within your existing Chrome window, or in a new window. You may have to select the Console tab.
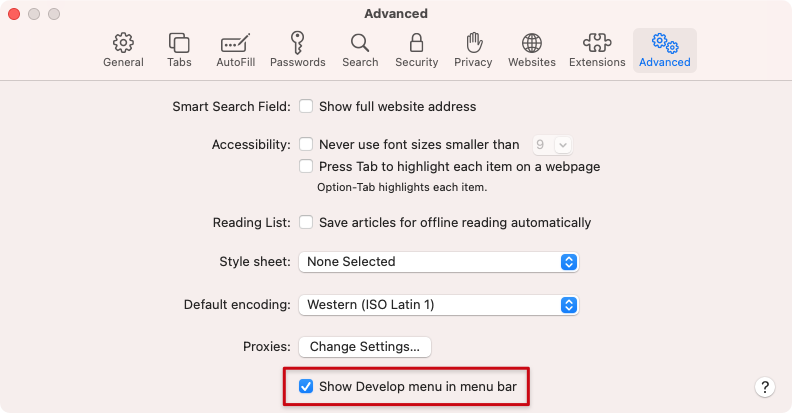
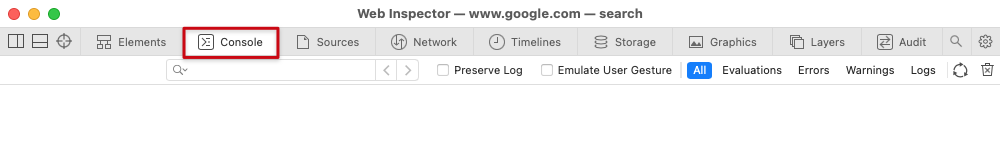
Safari
- Open Safari.
- Go to “Safari” in the top menu.
- Select “Preferences.”
- Click on the “Advanced” tab.
- Check the box next to “Show Develop menu in menu bar.”
- You’ll now see a “Develop” menu in the top menu bar. Click on it and select “Show JavaScript Console.”
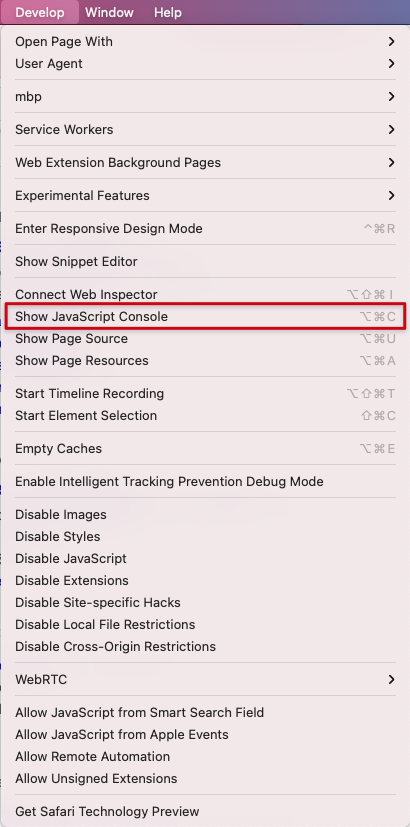
- The console will either open up within your existing Safari window, or in a new window. It will automatically select the Console tab.
Mozilla Firefox
- Open Firefox.
- Click the three horizontal lines in the upper right corner (menu icon).
- Select “Web Developer” and then “Web Console.” You can also use the keyboard shortcut
Ctrl + Shift + KorCmd + Option + K(on Mac).
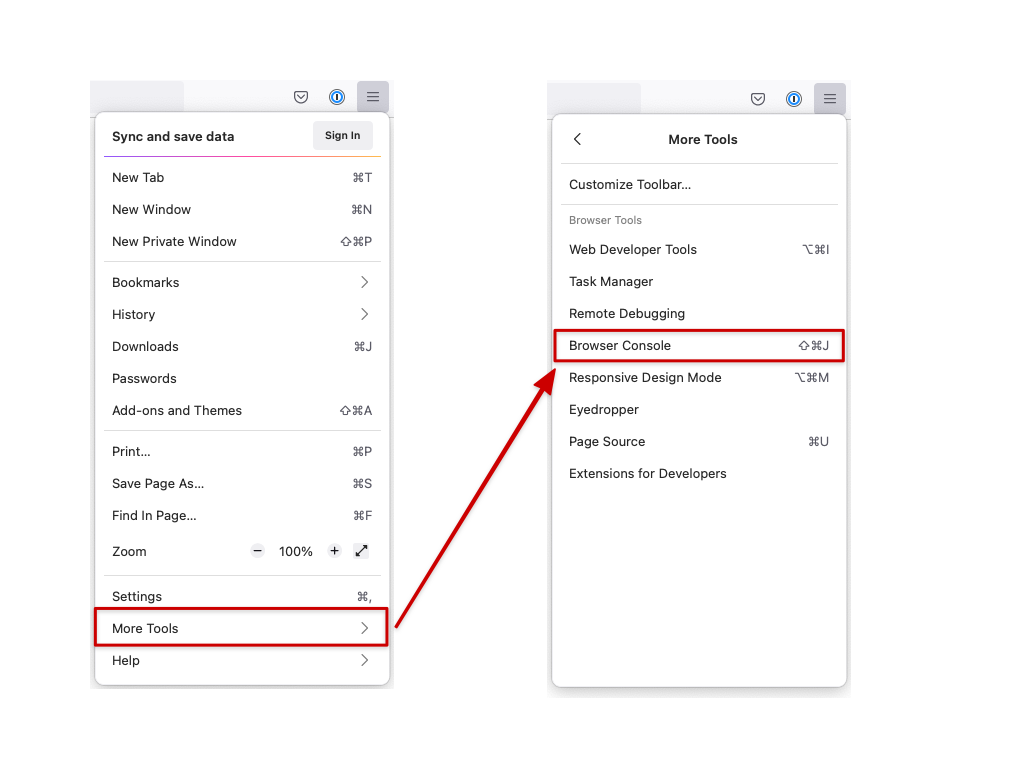
- The Browser console will open in a new window.
Microsoft Edge
- Open Edge.
- Click the three horizontal dots in the upper right corner (menu icon).
- Go to “More tools” and select “Developer tools.” You can also use the keyboard shortcut
Ctrl + Shift + IorCmd + Option + I(on Mac).
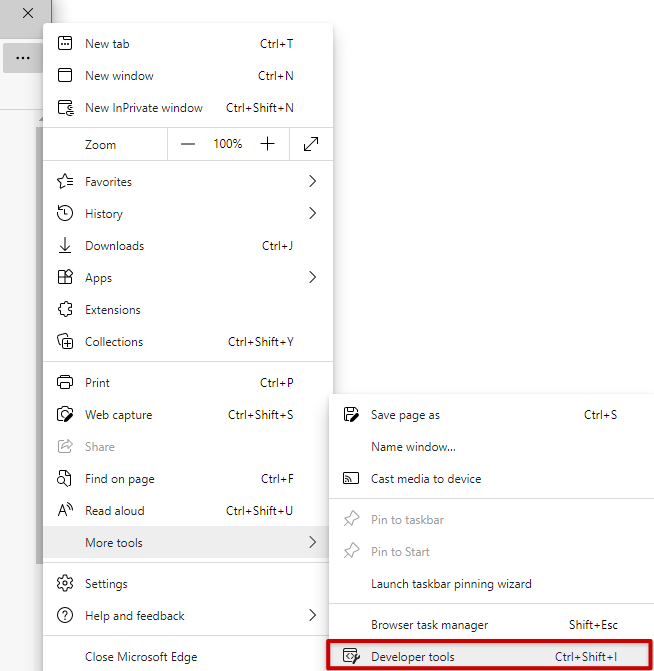
- The console will either open up within your existing Edge window, or in a new window. You may have to select the Console tab.
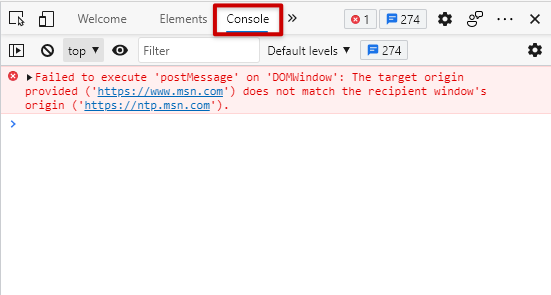
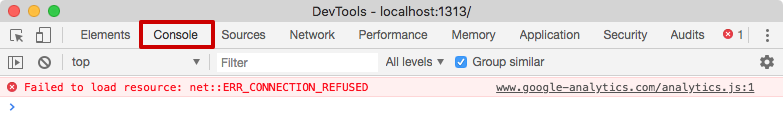
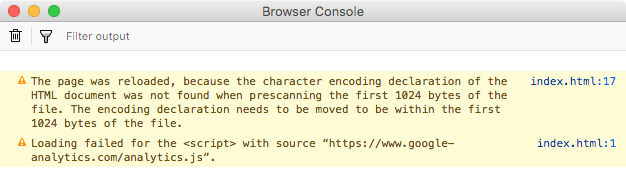
Once you’ve opened the developer console, you can view error messages to help diagnose and troubleshoot issues with websites or plugins. Please copy them or simply take a screensht.